Identify and Manage Page Errors with the New Error Console in Spring ’26
If you’ve spent time administering or building in Salesforce, you know this reality well: not all errors are dramatic calling for absolute attention. Some errors don’t crash the page, throw a red banner, or get reported. They just quietly break isolated things.

A button doesn’t work the way it should. A component fails to load correctly. A user gets a weird experience but keeps moving. And unless someone takes a screenshot and sends it your way, those issues can sit there causing headaches for weeks. Salesforce’s Spring ’26 release introduces a new Error Console in Lightning Experience designed to solve that problem. It gives admins and builders visibility into non-fatal page errors that previously flew under the radar, while keeping the user experience uninterrupted.
Let’s walk through what the Error Console is, why it’s valuable, and how to start using it.
The Problem: Silent Errors Are Still Errors
Traditionally, Salesforce has done a decent job surfacing fatal errors. When something truly breaks, users see a modal error window and can’t continue until it’s dismissed. Those get reported quickly because they stop work cold. But non-fatal errors are a different story.
These are issues that don’t crash the page but still impact the experience:
-
A Lightning component fails to render correctly

-
A script throws an error but the page still loads
-
A UI action doesn’t fully complete
-
A warning appears but users ignore it
From a technical standpoint, these matter. They can indicate misconfigurations, performance problems, or bugs that will eventually become bigger issues. From a practical standpoint, admins often don’t see them.
That means you’re left reacting to tickets like: “This page feels weird,” or, “Something didn’t work but I can’t explain it.”
The new Error Console aims to close that gap by giving you visibility into these “silent” problems before they escalate.
What the Error Console Does
The Error Console is a centralized panel in Lightning Experience that collects both non-fatal and fatal page-level errors. Instead of interrupting users every time something minor goes wrong, Salesforce logs those issues quietly and makes them available in one place.
When enabled, the console:
-
Captures non-fatal component and page errors
-
Collects warnings that might affect performance or behavior
-
Stores fatal errors for later inspection
-
Displays everything in a single, accessible panel
Non-fatal errors don’t interrupt your work. Instead, they are simply logged and available for when you’re ready to review them. On the other hand, fatal errors still appear in modal windows that require dismissal, but those errors are also logged in the console for reference. As you can imagine, this gives admins and developers a more complete view of what users are actually encountering in Lightning Experience.
Where You’ll Find It
This feature applies to Lightning Experience and can be enabled in Setup.
To turn it on:
-
Go to Setup
-
Enter User Interface in Quick Find
-
Select User Interface
-
In Advanced Settings, enable:
Use Error Console for error reporting in Lightning Experience

Once enabled, the console begins capturing errors across pages and components.
There’s no disruption to users and no extra interaction required. It just starts collecting data.
How It Works in Practice
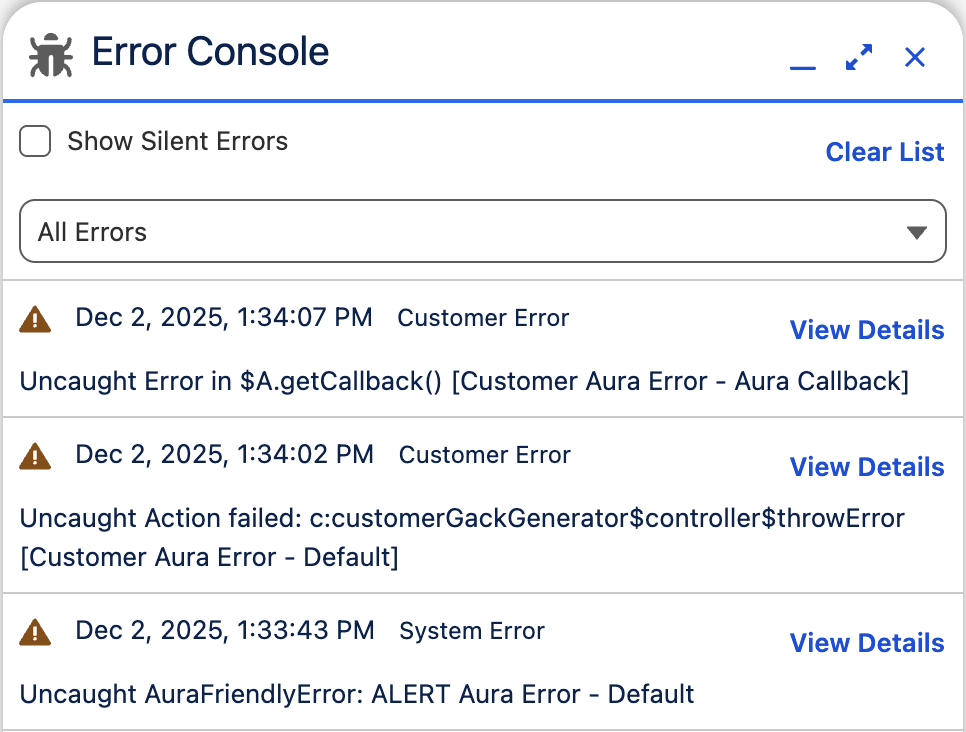
When a non-fatal error or warning occurs, the Error Console appears in the bottom-right corner of the page. It starts in a collapsed state so it doesn’t get in the way. Users and admins can keep working normally. The console continues to collect issues in the background.
When you expand it, you’ll see a list of recent errors and warnings. This includes:
-
Non-fatal errors
-
Warnings
-
Fatal errors (which redundantly appear in modal windows)
Each entry includes a View Details option. Clicking it reveals technical information similar to what you’d see in the “Technical Stuff” section of a traditional error message. This makes it easier to capture and share error details with your admin or developer team without needing screenshots or guesswork.
Why the Error Console Matters for Admins
For admins, this feature is less about convenience and more about visibility.
Historically, troubleshooting has relied heavily on user reports. If users don’t report something, you might not know it exists. And if they do report it, the information is often incomplete or vague.
With the Error Console, instead of waiting for complaints, you can proactively review issues and spot patterns.
Here are a few ways it helps:
Catch Recurring Problems Early
If a component throws a non-fatal error repeatedly, you’ll see it. That gives you a chance to fix it before it becomes a larger issue or starts generating tickets.
Improve Page Reliability
Some errors don’t break functionality immediately but still degrade performance or reliability over time. Now you have visibility into those.
Share Better Diagnostics
When working with developers or support, having detailed error logs makes conversations faster and more productive. You’re not relying on vague descriptions.
Reduce User Friction
Because non-fatal errors don’t interrupt users, their workflow stays intact. Meanwhile, you still get the information you need to address the problem.
A More Modern Debugging Experience
This change also reflects a broader trend in Salesforce’s recent releases: improving the builder and admin experience by reducing friction. Instead of surfacing every minor issue with a disruptive popup, Salesforce now lets work continue while still capturing the data behind the scenes.
It’s closer to what many modern development environments do. Errors are logged, visible, and actionable, but they don’t always halt progress. For admins managing complex Lightning pages and custom components, you get more insight without more interruptions.
Best Practices for Using the Error Console
If you plan to enable this feature, consider adding a simple review process. Check the console periodically and make it part of your weekly admin routine, scanning for recurring errors or warnings. Look for patterns. One error might not matter, but repeated errors usually do. If your org includes custom components or integrations, coordinate with developers and share any findings so issues can be addressed quickly. It’s also helpful to keep an eye on the console during testing when rolling out new features, as it can surface problems early. This isn’t meant to create more work. It’s meant to make your existing troubleshooting more proactive and a lot less reactive.
Error Console Availability
The Error Console is part of the Spring ’26 release and will become available once your org is upgraded to that version. Salesforce rolls releases out in waves, so some preview sandboxes and dev orgs may see it earlier than others. If you don’t see the setting yet, your org likely hasn’t been upgraded to Spring ’26.
Final Thoughts
The Error Console isn’t flashy. It won’t make headlines the way new automation features or AI tools do. But for admins and builders, it solves a very real and very common problem. Silent errors are still errors, and now you can actually see them.
By centralizing page-level issues in Lightning Experience, Salesforce gives you the ability to monitor, diagnose, and fix problems more effectively. You don’t have to wait for users to report broken pages. You can spot issues early and address them before they grow.
Sometimes the most valuable updates aren’t about adding more functionality. They’re about making the platform easier to maintain, easier to troubleshoot, and easier to trust.
Explore related content:
Solve the Flow Picklist Record Type Gap with Vibe Coding
The Ultimate Guide to the Salesforce Screen Flow File Preview Component
Spring ’26 Release Notes: Highlights for Admins and Developers
