How to Measure Flow Performance And Why You Should Care

In the Salesforce ecosystem, best practice “myths” tend to circulate widely, often shared and reused without critical evaluation or validation. Many users rely on outdated advice from external sources without realizing how much the platform has evolved.

With three major Salesforce releases every year, the technology moves fast, and what was considered a best practice last year might be obsolete today. Salesforce Flows, in particular, are among the most affected by this rapid pace of change.
Salesforce continues to champion the citizen developer approach: encouraging non-technical users to build automation solutions (hopefully not directly in production!). While this democratizes development, it also increases the risk of poor implementations if users don’t stay up to date.
Every new release brings powerful updates, but with great power comes great responsibility.
What’s Common Knowledge (and Still Worth Highlighting)?
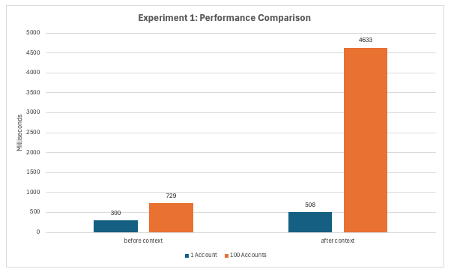
The Salesforce Architect Blog features a comprehensive and highly informative article on trigger-based automation. One standout section, Experiment 1, includes a detailed performance comparison chart that measures execution speed across different automation types.
Legacy tools like Workflow Rules and Process Builder, both of which have reached end-of-life status (check this article official announcement), are deliberately greyed out in the chart, signaling their phased retirement and reduced relevance for future projects.

This visual makes one thing clear: modern automation in Salesforce is not just about functionality, but also about performance and maintainability. If you’re still relying on outdated tools, it’s time to rethink your architecture.

If you’re unsure about the difference between “before” and “after” in record-triggered Flows, you’re not alone. Understanding where and when automation runs is crucial for building performant and reliable solutions in Salesforce.
I recommend reading this in-depth guide on the Save Order (also known as the Order of Execution) to get a clear understanding of how and when different types of automation are executed:
👉 Before vs. After in Record-Triggered Flows
Mastering this concept will help you avoid common pitfalls like uncommitted data, duplicate executions, or validation errors down the line.
Should You Really Care About Flow Performance?
If you’re asking yourself whether any of this actually matters, the short answer is yes. But let’s break it down.
In a small Salesforce org with only one Flow running on an object, and with minimal logic, the performance difference between a well-optimized Flow and a poorly configured one might not feel dramatic. An automation being 85 times faster or slower sounds significant, but in isolated cases we’re still talking about milliseconds.
However, things change quickly when:
-
Dependencies start stacking up
-
Multiple Flows run on the same object
-
You’re dealing with larger volumes of data or batch operations
-
You introduce subflows, loops, and external calls
That’s where performance hits become very real, and potentially very costly.
Let’s take things one step further and examine how Flow design decisions scale with complexity.
Experiment 1: Five Automations on the Same Object
Now let’s scale things up.
When five separate updates are triggered on the same record, performance differences become far more noticeable. Sure, you might not always be processing 100 records at once, but when you are, a 4-second delay is something users will feel.
This experiment highlights the real-world impact of Flow design decisions. It’s not just about milliseconds anymore, it’s about cumulative effects under load, and how seemingly small inefficiencies can snowball into real performance bottlenecks.
Other Logic That Can Impact Performance
Flows aren’t the only form of automation that can affect performance in your Salesforce org. There are several declarative and behind-the-scenes processes that may significantly influence execution time and system behavior, especially when layered together.
Here are some common mechanisms to keep an eye on:
-
Assignment Rules
-
Auto-Response Rules
-
Escalation Rules
-
Sharing Calculations
-
Roll-Up Summaries
-
Validation Rules
-
Duplicate Management Rules
When troubleshooting or optimizing performance, make sure to consider all active automation layers, not just Flows or Apex. These processes can silently add delays, consume limits, or trigger additional logic chains.
How Can You Measure Flow Performance Yourself?
Want to analyze Flow performance on your own? You can do it using Salesforce’s Developer Console, or even better, use powerful tools like Visual Studio Code with the Apex Log Analyzer extension.
Step 1: Set Up Visual Studio Code for Salesforce Development
If you’re new to using VS Code with Salesforce, there’s a great Trailhead guide that walks you through connecting your Salesforce org. Once you’re set up, you can install useful developer extensions.
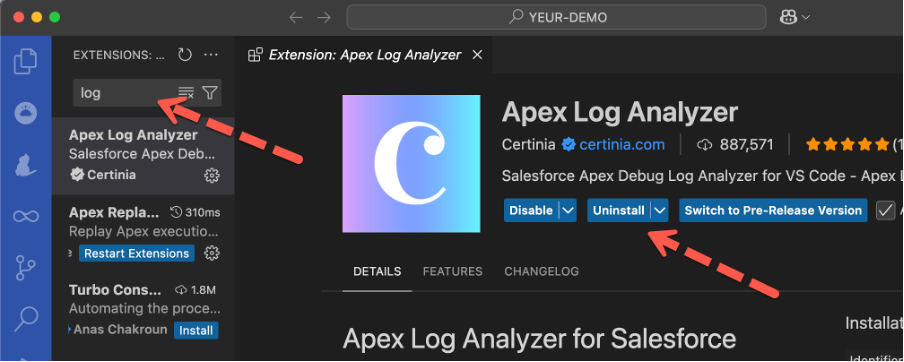
Step 2: Install the Apex Log Analyzer Extension
Navigate to the Extensions tab in VS Code and search for “Apex Log Analyzer”. It’s quick to install and gives you a clean, visual way to understand what’s happening in your automation.
Step 3: Enable Debug Logs for Your User
Before you can analyze Flow performance, you need to enable Debug Logs for your user. Here’s a helpful Salesforce Help article on how to do that.
Without an active Debug Log, no runtime data will be captured. This means you won’t be able to see how long your Flows are taking to execute.
Step 4: Create or update a record that will trigger a flow
Based on your setup, updating or creating an account or contact will maybe do the job. Otherwise check all active flows and their entry criteria.
Step 5: Retrieve and Analyze Logs in VS Code
Once Debug Logs are available, simply open Visual Studio Code and run the command:
“Log: Retrieve Apex Log and Show Analysis”
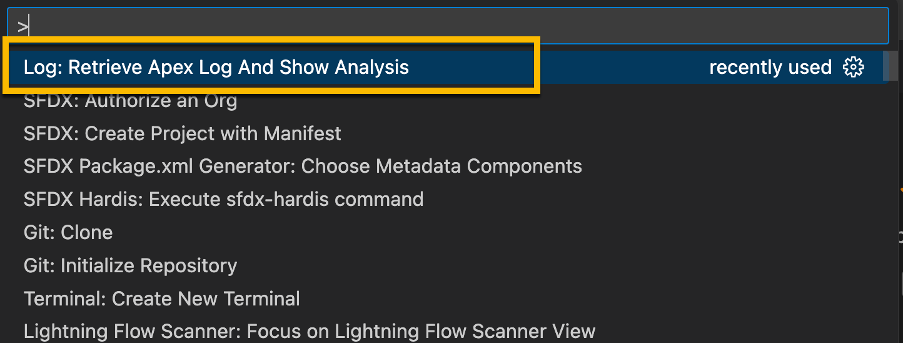
VS Code will fetch the latest logs and automatically generate a visual graph of execution time. Use the most recent Debug Log to uncover which elements in your Flow are consuming the most time.
Analyze the result
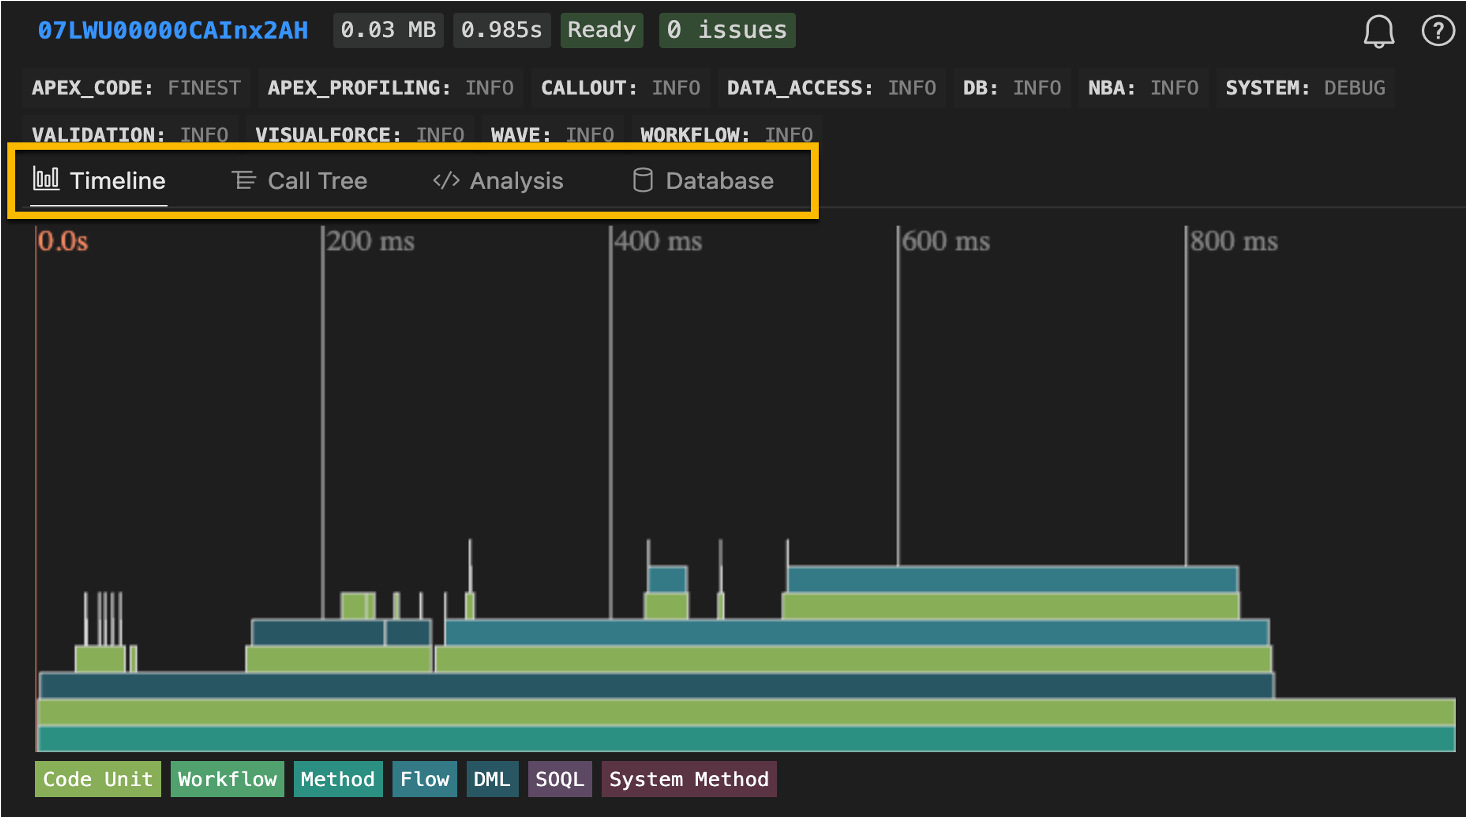
The Apex Log Analyzer comes with multiple views. Each view offers unique insights that can help you fine-tune your Salesforce automations for maximum performance.
Timeline View – The Starting point
When diving into performance analysis with the Apex Log Analyzer, your best starting point is the Timeline View. It provides a clear, visual breakdown of your Flow’s execution over time: perfect for spotting bottlenecks at a glance.
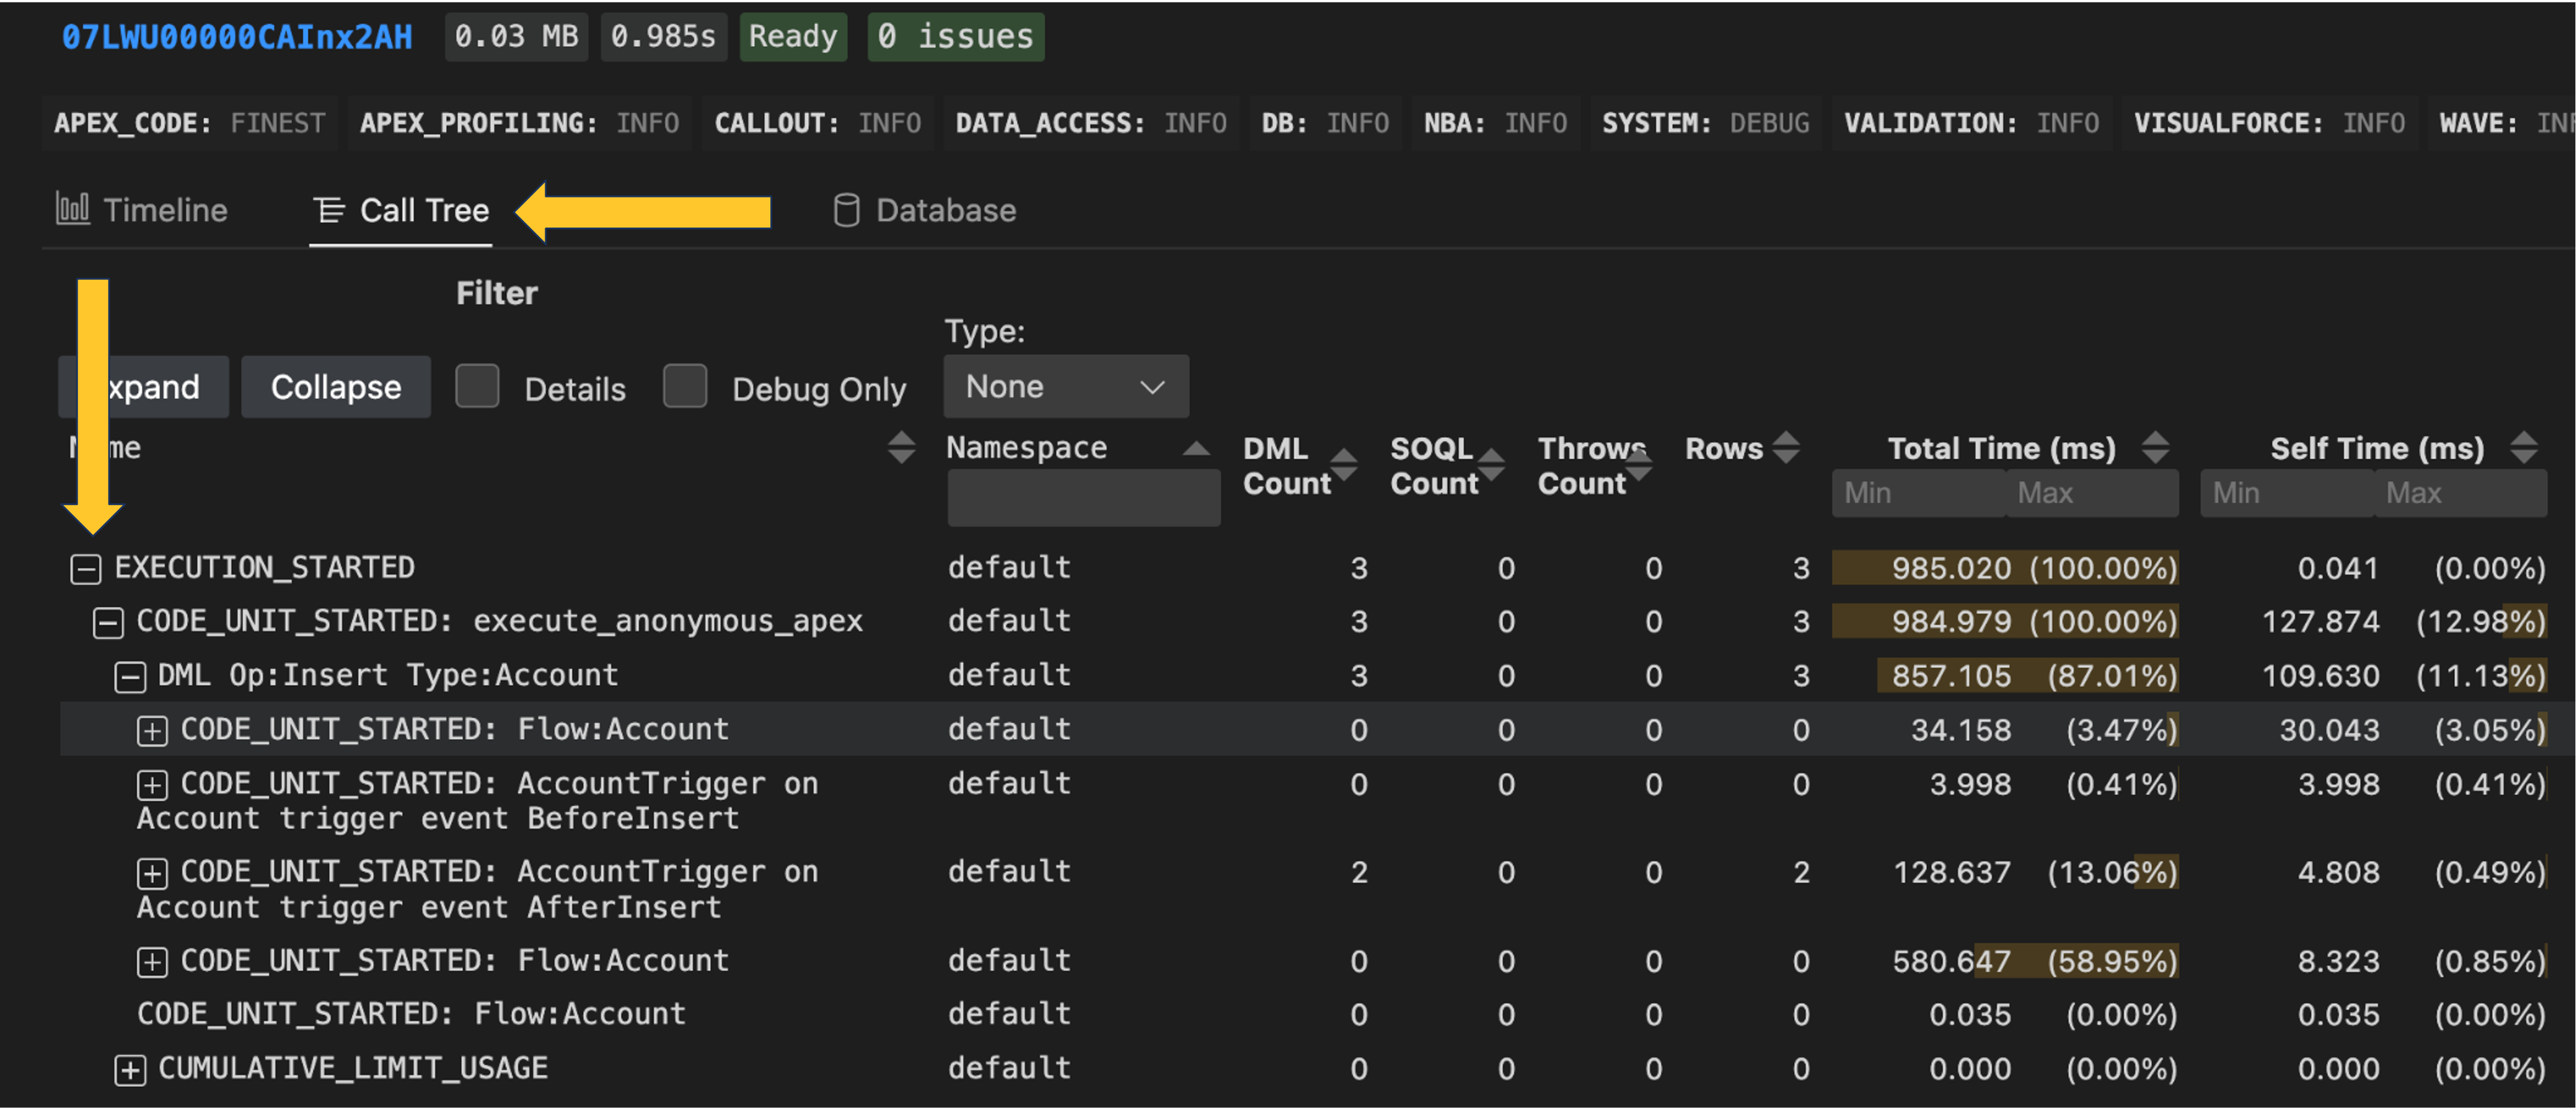
Call Tree and many more
If your object contains a large amount of logic or multiple layers of automation, the Call Tree View may be the better choice for performance analysis.
This view allows you to expand execution steps hierarchically, diving into each layer one level at a time. This way, you’re not overwhelmed by the full volume of information all at once, and you can methodically trace the flow of logic from top to bottom.
It’s especially helpful when debugging complex Flows, Apex calls, and nested automation.
From there, feel free to explore other powerful views such as:
-
Call Tree – See the hierarchical structure of method calls
-
Analysis – Get a summarized breakdown of execution steps
-
Database – Understand DML usage and query patterns
Which Flow Performance Myths Can You Bust Yourself?
Ready to put theory into practice? Here are some hands-on experiments you can try to see just how much impact optimization can have on your Salesforce Flow performance:
-
Refactor a poorly built Flow by moving logic from the after context to the before context
-
Compare one Flow per object vs. multiple Flows per object
-
Replace a Loop with a Transform element
-
Use an Invocable Apex method that leverages a Map instead of writing nested loops in Flow
-
Offload complex or long-running logic to run asynchronously
Each of these tests can help you uncover real performance gains, and debunk some of the common myths that circulate in the Salesforce ecosystem.
Optimization Comes with Trade-Offs
Before you rush to refactor everything, remember: every optimization comes with trade-offs. There’s no single best practice that fits all use cases.
Performance improvements must always be balanced against:
-
The size and complexity of your Salesforce org
-
The skill level of your admins and developers
-
Your team’s available capacity and resources
-
Existing technical debt and legacy constraints
-
The maintainability and extensibility of your solutions
Speed is important, but so are clarity, future-proofing, and team enablement. Make conscious decisions that align with both your short-term performance needs and your long-term platform strategy.
Conclusion: Stay Curious, Stay Current
The truth is, Salesforce Flow best practices aren’t carved in stone, they evolve with every release. What was once a hard rule might now be a performance myth, and yesterday’s workaround could be tomorrow’s built-in feature. The admins and architects who succeed long term aren’t the ones who memorize static rules, they’re the ones who continually test, validate, and adapt.
Instead of chasing outdated “dos and don’ts,” build a habit of critical evaluation. Ask yourself: Does this recommendation still apply with the latest release? Have I validated this in my own org? Is the trade-off worth it for my team’s size and complexity?
By keeping a questioning mindset, you’ll avoid blindly following myths, and instead, you’ll design automation that’s smarter, faster, and more resilient.
Explore related content:
Salesforce Winter ’26 Release: Comprehensive Overview of New Flow Features
Demystifying Code for Salesforce Admins
Error Busters: Guide to Solving Flow and Apex Trigger Errors in Salesforce
How the Transform Element Saves You Loops
Salesforce Summer ’25 Preview: Major Flow Changes to Watch For
